

Calling the viewer
To show the Gui you have to call the fact.ShowViewer Processor. Just like you’d call any other Processor. It requires the key=<some_key> parameter to know what data to display. It takes the optional range="min,max" parameter which specifies the default plot range of the main window.
<fact.ShowViewer key="DataCalibrated" range="25,250"/>
Displaying stuff in the viewer
Each time an event is passed to the viewer it will search the data item for data it can display. That means overlays for the camera display and arrays for the plot window.
By clicking Window -> Graph Window in the FactViewer you can see the slices of selected pixels in the Camera.
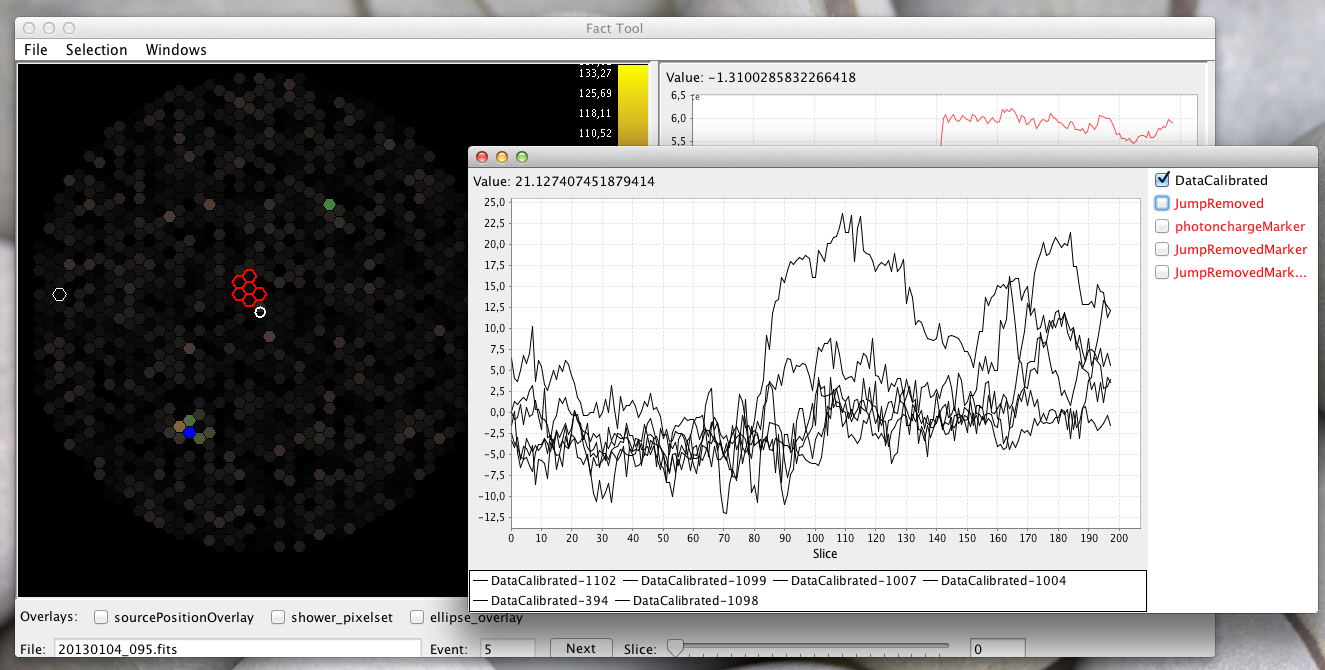
The Graph Window will try to display all double arrays with the right size. That means it has to be dividable by the number of pixels in the camera. If you want to display your data in this window simply add an array of the right length to the data item in your processor.
    public class MyAwesomeProcessor implements Processor {
              @Override
              public Data process(Data item) {
                ...
                double[] myAwesomeData = new double[1440*300]
                ... do something with data
                input.put("MyAwesomeData", myAwesomeData);
                return input;
              }
    }
This allows for quick comparisons and sanity checks of transformed data. You can select the color to display by clicking on the button next your data in the plot window. For more information on colormaps see Colormaps
Coloring a time interval
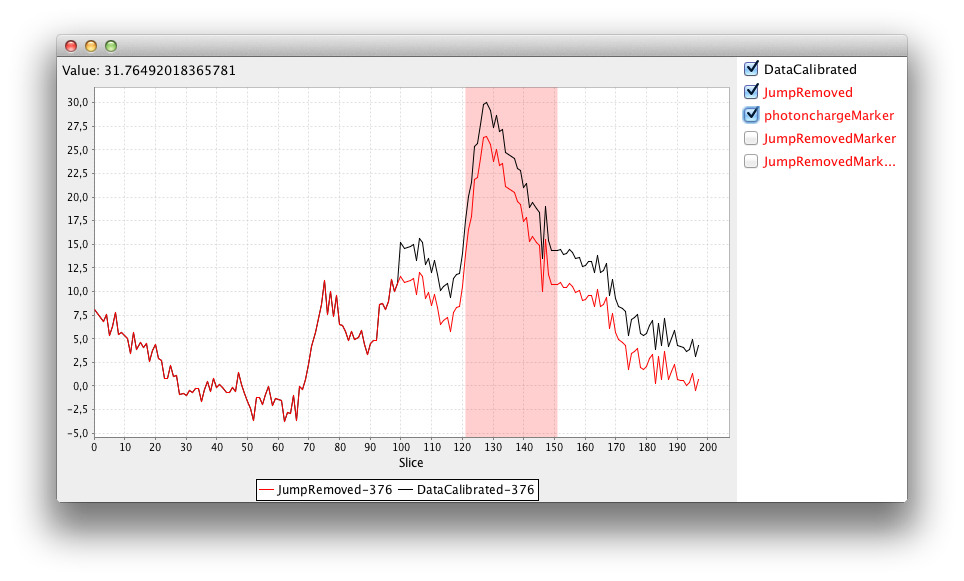
Some processors try to find some point in time or a certain time interval in the time series by some criteria. Since it can be useful to actually see what your algorithm is doing you can set the background color for a time interval in the series. This works by adding an IntervalMarker for each pixel in the event.
    IntervalMarker[] m = new IntervalMarker[Constants.NUMBEROFPIXELS];

    for(int pixel : allPixel){
        m[pixel] =  new IntervalMarker(startposition , endposition, new Color(r,g,b, alpha));
    }

    input.put("Marker", m);
The Graph Window will automatically show you the option to display the selected interval.