

Bar Plot
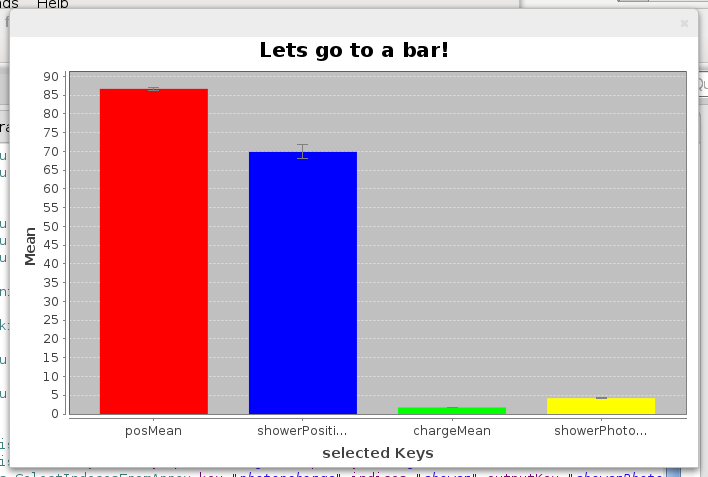
Its often useful to compare accumulated values using a bar plot. A bar plot can provide a quick visual estimate of the differences between features and their stability by drawing error bars. The BarPlotter processors found in the package fact.plotter can plot several bars in one window. In this example we calculate the arrival time and the photon charge for the whole image and compare them to the values for just the shower pixels.
  ...

  <stream id="fact-data" ... />

  <process input="fact-data">
     ...
     <!-- calculate arrival times and all the otehr intresting stuff here -->
     ...

     <!-- photoncharge for the whole camera -->
     <fact.statistics.ArrayMean key="photoncharge" outputKey="chargeMean" />

     <!-- just for the shower -->
     <fact.utils.SelectIndecesFromArray key="photoncharge" indices="shower" outputKey="showerPhoton" />
     <fact.statistics.ArrayMean key="showerPhoton" outputKey="showerPhotonChargeMean" />

     <!-- arrivaltime for the whole camera -->
     <fact.statistics.ArrayMean key="arrivaltime" outputKey="posMean" />
     <!-- just for the shower -->
     <fact.utils.SelectIndecesFromArray key="arrivaltime" indices="shower" outputKey="showerPos" />
     <fact.statistics.ArrayMean key="showerPos" outputKey="showerPositionMean" />


     <fact.plotter.BarPlotter title="Lets go to a bar!" keys="
        posMean,showerPositionMean,chargeMean,showerPhotonChargeMean" />

  </process>
  ...
During the processing a new window will pop up containing four bars. Thats one for each key. Each processed event will update the plot.
A bit more useful to judge the evenness of a measurement over the camera will be the CameraPlotter.